Hunting a bug in the i40e Intel driver
A few months ago, after finally having received the new disks for our new Ceph
cluster, we decided to benchmark them, so we could tune our cluster to get the
best performance out of it, but that’s a story for another time. After setting
everything up for our first benchmark, and starting it, we knew it would take
about an hour and a half before completion, so in the meantime, we moved on to
other things. Coming back to the test after about two hours, it still hadn’t
finished, and it was stuck somewhere at the beginning. During our preparation
for it, we had run into this issue, and we thought it was just the tool that
was mis-configured. However, after running a simple ceph status, we saw that
some Ceph services (in this particular case, a monitor, a manager and two OSDs)
were down. There was no joy in SSHing to the node (hereafter called node-1)
that was running those services as it wasn’t answering anymore. We had to use
the machine’s iDRAC (a remote control interface embedded into the server) to
find a kernel panic on its console and force-reboot the machine.
Source of the panic
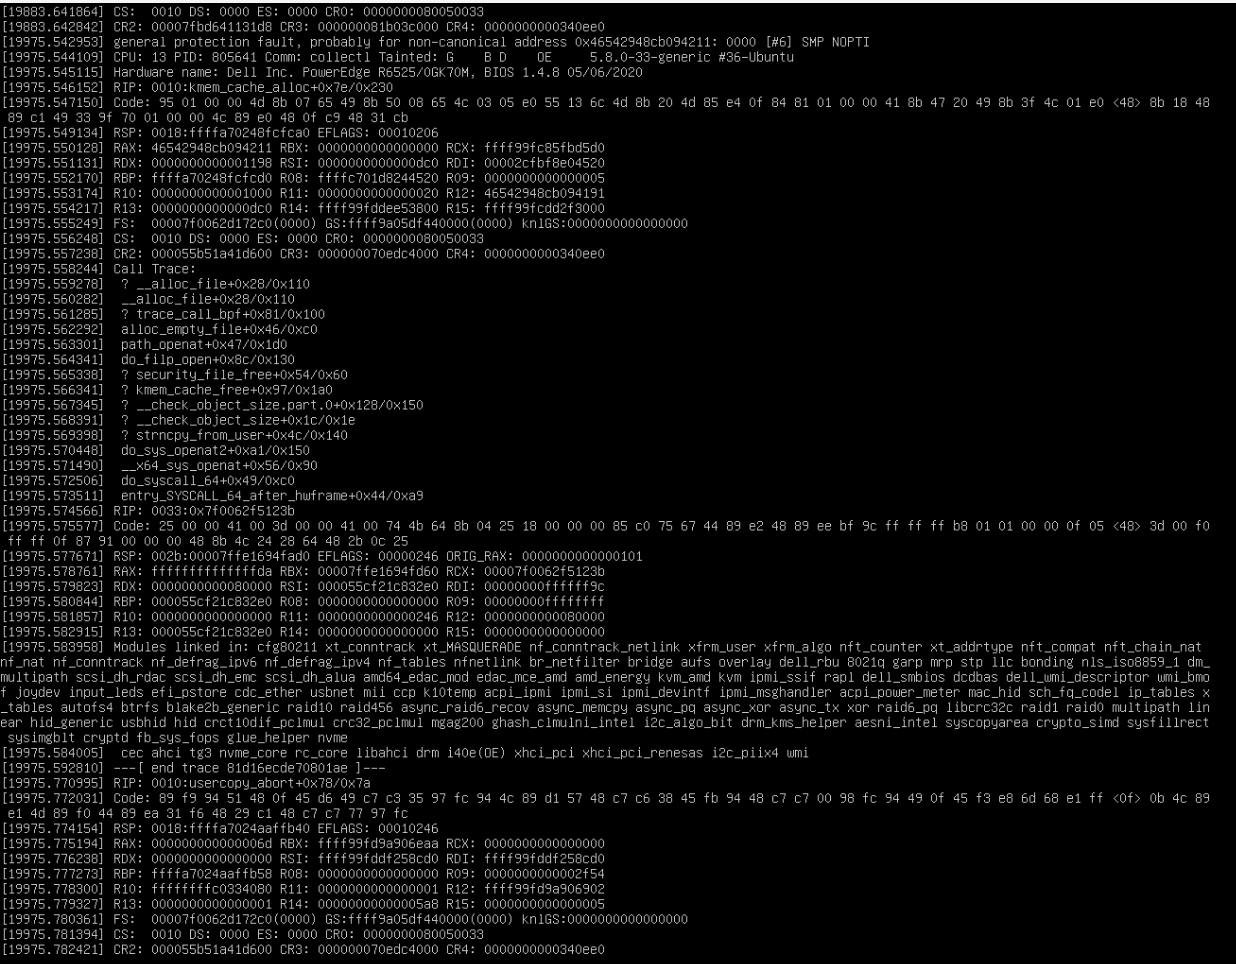
To better understand why the kernel panicked, we started to panic with it, thinking there might be a huge problem with our brand new servers. Looking at the call trace from the kernel didn’t give us a lot of information, except that it could be memory-related. After a successful reboot, we went to the kernel logs from the previous boot to see what had happened. The first stack trace we were greeted with was this one (excluding some lines to keep it short):
kernel: Call Trace:
kernel:  __check_heap_object+0xe7/0x110
kernel:  __check_object_size.part.0+0x128/0x150
kernel:  __check_object_size+0x1c/0x1e
kernel:  simple_copy_to_iter+0x2b/0x50
kernel:  __skb_datagram_iter+0x19f/0x2e0
kernel:  ? zerocopy_sg_from_iter+0x50/0x50
kernel:  skb_copy_datagram_iter+0x40/0x90
kernel:  tcp_recvmsg+0x6a4/0xa10
kernel:  ? _cond_resched+0x1a/0x50
kernel:  ? aa_sk_perm+0x43/0x1b0
kernel:  inet_recvmsg+0x5e/0x100
kernel:  sock_recvmsg+0x69/0x80
kernel:  __sys_recvfrom+0xe5/0x1d0
kernel:  ? _cond_resched+0x1a/0x50
kernel:  ? ktime_get_ts64+0x4c/0xf0
kernel:  ? __prepare_exit_to_usermode+0x62/0xe0
kernel:  __x64_sys_recvfrom+0x29/0x30
kernel:  do_syscall_64+0x49/0xc0
kernel:  entry_SYSCALL_64_after_hwframe+0x44/0xa9
kernel: RIP: 0033:0x7fb86243cddc
Clearly something went wrong with the network, as the stack trace includes
calls to network-related methods such as sock_recvmsg and inet_recvmsg.
Searching a bit more through the stack traces (there were a lot, 230 to be
exact), we stumbled upon this one:
kernel: BUG: Bad page state in process swapper/57  pfn:7d518e
kernel: page:ffffe4f71f546380 refcount:0 mapcount:0 mapping:0000000000000000 index:0xffff99fd5518fe00 head:ffffe4f71f546380 order:1 compound_mapcount:0
kernel: flags: 0x57ffffc0010200(slab|head)
kernel: raw: 0057ffffc0010200 dead000000000100 dead000000000122 ffff99fce07cce00
kernel: raw: ffff99fd5518fe00 00000000802a0029 00000000ffffffff 0000000000000000
kernel: page dumped because: PAGE_FLAGS_CHECK_AT_FREE flag(s) set
kernel: Modules linked in: cfg80211 xt_conntrack xt_MASQUERADE nf_conntrack_netlink xfrm_user xfrm_algo nft_counter xt_addrtype nft_compat nft_chain_nat nf_nat nf_conntrack nf_defrag_ipv6 nf_defrag_ipv4 nf_tables nfnetlink br_netfilter bridge aufs overlay dell_rbu 8021q garp mrp stp llc bonding nls_iso8859_1 dm_multipath scsi_dh_rdac scsi_dh_emc scsi_dh_alua amd64_edac_mod edac_mce_amd amd_energy kvm_amd kvm ipmi_ssif rapl dell_smbios dcdbas dell_wmi_descriptor wmi_bmof joydev input_leds efi_pstore cdc_ether usbnet mii ccp k10temp acpi_ipmi ipmi_si ipmi_devintf ipmi_msghandler acpi_power_meter mac_hid sch_fq_codel ip_tables x_tables autofs4 btrfs blake2b_generic raid10 raid456 async_raid6_recov async_memcpy async_pq async_xor async_tx xor raid6_pq libcrc32c raid1 raid0 multipath linear hid_generic usbhid hid crct10dif_pclmul crc32_pclmul mgag200 ghash_clmulni_intel i2c_algo_bit drm_kms_helper aesni_intel syscopyarea crypto_simd sysfillrect sysimgblt cryptd fb_sys_fops glue_helper nvme
kernel:  cec ahci tg3 nvme_core rc_core libahci drm i40e(OE) xhci_pci xhci_pci_renesas i2c_piix4 wmi
kernel: CPU: 57 PID: 0 Comm: swapper/57 Tainted: G    B D    OE     5.8.0-33-generic #36-Ubuntu
kernel: Hardware name: Dell Inc. PowerEdge R6525/0GK70M, BIOS 1.4.8 05/06/2020
kernel: Call Trace:
kernel:  <IRQ>
kernel:  show_stack+0x52/0x58
kernel:  dump_stack+0x70/0x8d
kernel:  bad_page.cold+0x63/0x94
kernel:  check_free_page_bad+0x66/0x70
kernel:  __free_pages_ok+0xb8/0x310
kernel:  page_frag_free+0x5f/0x80
kernel:  skb_release_data+0x102/0x1b0
kernel:  __kfree_skb+0x26/0x40
kernel:  tcp_data_queue+0x1ce/0x570
kernel:  ? tcp_init_transfer+0x108/0x170
kernel:  tcp_rcv_state_process+0x2c6/0x82f
kernel:  tcp_child_process+0xa5/0x1a0
kernel:  tcp_v4_rcv+0xa28/0xdd0
kernel:  ip_protocol_deliver_rcu+0x30/0x1b0
kernel:  ip_local_deliver_finish+0x48/0x50
kernel:  ip_local_deliver+0xe3/0xf0
kernel:  ? ip_protocol_deliver_rcu+0x1b0/0x1b0
kernel:  ip_sublist_rcv_finish+0x3d/0x50
kernel:  ip_list_rcv_finish.constprop.0+0x163/0x190
kernel:  ip_sublist_rcv+0x36/0xa0
kernel:  ? ip_rcv_finish_core.constprop.0+0x310/0x310
kernel:  ip_list_rcv+0xf5/0x118
kernel:  __netif_receive_skb_list_core+0x228/0x250
kernel:  __netif_receive_skb_list+0x102/0x170
kernel:  ? tcp4_gro_receive+0x115/0x1a0
kernel:  netif_receive_skb_list_internal+0xc5/0x180
kernel:  napi_complete_done+0x7a/0x1a0
kernel:  i40e_napi_poll+0x137f/0x1720 [i40e]
kernel:  ? check_preempt_curr+0x84/0x90
kernel:  napi_poll+0x96/0x1b0
kernel:  net_rx_action+0xb8/0x1c0
kernel:  __do_softirq+0xd0/0x2a1
kernel:  asm_call_irq_on_stack+0x12/0x20
kernel:  </IRQ>
kernel:  do_softirq_own_stack+0x3d/0x50
kernel:  irq_exit_rcu+0x95/0xd0
kernel:  common_interrupt+0x7c/0x150
kernel:  asm_common_interrupt+0x1e/0x40
kernel: RIP: 0010:native_safe_halt+0xe/0x10
kernel: Code: e5 8b 74 d0 04 8b 3c d0 e8 6f b3 49 ff 5d c3 cc cc cc cc cc cc cc cc cc cc cc cc cc e9 07 00 00 00 0f 00 2d 66 ee 43 00 fb f4 <c3> 90 e9 07 00 00 00 0f 00 2d 56 ee 43 00 f4 c3 cc cc 0f 1f 44 00
kernel: RSP: 0018:ffffa70240577e70 EFLAGS: 00000246
kernel: RAX: ffffffff947cd3a0 RBX: ffff99fddb499780 RCX: ffff99fddf26d440
kernel: RDX: 0000000007b73c42 RSI: 0000000000000039 RDI: ffff99fddf25fa80
kernel: RBP: ffffa70240577e90 R08: 00000066a171bc54 R09: 0000000000000201
kernel: R10: 0000000000000029 R11: 0000000000013400 R12: 0000000000000039
kernel: R13: 0000000000000000 R14: 0000000000000000 R15: 0000000000000000
kernel:  ? __cpuidle_text_start+0x8/0x8
kernel:  ? default_idle+0x20/0x140
kernel:  arch_cpu_idle+0x15/0x20
kernel:  default_idle_call+0x2c/0x30
kernel:  cpuidle_idle_call+0x173/0x200
kernel:  do_idle+0x7a/0xe0
kernel:  cpu_startup_entry+0x20/0x30
kernel:  start_secondary+0xe6/0x100
kernel:  secondary_startup_64+0xb6/0xc0
kernel: usercopy: Kernel memory exposure attempt detected from SLUB object 'anon_vma_chain(882:init.scope)' (offset 2, size 1448)!
kernel: ------------[ cut here ]------------
kernel: kernel BUG at mm/usercopy.c:99!
kernel: invalid opcode: 0000 [#5] SMP NOPTI
The first thing to notice here is the first line: Bad page state in process swapper. Some process, swapper, tried to access a memory page it wasn’t
supposed to. What that process is, is anyone’s guess, but what’s more important
is that we had the call trace which lead to this error, and in it, this line:
i40e_napi_poll+0x137f/0x1720 [i40e]. The brackets here specify which kernel
module the function is located in. It’s only present for out-of-tree modules.
And indeed, we had installed a custom i40e driver!
While we were analyzing all that, the Ceph cluster was still operating on two
other nodes (hereafter node-2 and node-3), and thus was trying to rebalance
data between the OSDs left, which caused node-2 to crash too. The clients we
used for the tests (hereafter node-4 and node-5) were fine.
Some context
Now that we have exposed what the problem is, let’s go back to understand how we got there. As stated earlier, we got five brand new servers for a Ceph cluster. With those, we also got 10 NVMe SSDs, 10 Optane SSDs and 5 Intel X722-DA2 network cards. Those cards are dual-port 10GbE adapters that support RDMA. To put it in a single sentence, RDMA is a process that allows another computer to access our computer’s memory without involving the operating system, and as such, without involving the CPU. This is particularly useful for a Ceph cluster, as it reduces latency for the clients. We made some tests with that, but again, it’s a story for another time. During those tests, we noticed the machines were randomly freezing after some time, so we decided to upgrade the firmware of the network cards, which potentially could fix the problem. Having done so, we checked the kernel logs to see if everything was going smoothly after the upgrade and we got this message:
i40e 0000:43:00.0: The driver for the device detected a newer version of the
NVM image v1.11 than expected v1.9. Please install the most recent version of
the network driver.
“That’s alright”, we thought, let’s just upgrade the driver. Oh, did we mention
that the i40e is the driver used for the X722 cards? At that point, we were
using the driver from the kernel, as in in-tree, at v5.8, with Ubuntu’s
patches applied on top of it, although none of them probably change anything in
that driver’s code. And so we went and downloaded the latest (2.13.10) version
of the driver from
Intel’s
website,
installed it, loaded it and got on with our lives, that is benchmarking Ceph.
There were some upgrades/downgrades of firmware and kernel modules along the
way, because the latest ones were not compatible for our RDMA tests, but let’s
forget about those and just remember that at this point we were on the 5.8
version of the kernel, with one out-of-tree module, i40e, at version 2.13.10.
We are not worrying about those, because during reproduction, we re-installed
the operating system a couple of times to remove any trace from our RDMA tests.
Until we arrived at the crash and the stack traces we described at the beginning of this article.
The actual hunt
Reproducing
The first step when finding a bug like this, is reproducing it, and having clear steps on how to do that.
Our first attempt at reproducing was starting the benchmark again, after
bringing the nodes that crashed back up. Pretty quickly, node-3 crashed,
followed by one of the other two nodes. Their kernel logs contained the same
stack traces we saw earlier. Why was node-3 crashing now, and not node-1 or
node-2 as before?
As we determined earlier, the problem was network-related, so we decided to
start another benchmark, but one that was only going to use the network this
time. Specifically, we were going to stress-test our network, as our Ceph
benchmarks were pretty network intensive. To do this, we used
iperf3, a speed test tool that runs over TCP, UDP and
SCTP. It works using a client-server scheme, i.e. you run an iperf3 server on
one machine and an iperf3 client on another machine and it tells you the
network speed between the two. As the X722 cards have two interfaces that we
set up using LACP, we were going to run two server and two clients on each
machine, like so:

Before starting this test, we also decided to reboot all the nodes. The iperf3 clients were started roughly at the same time, and indeed, two out of three machines crashed, meaning we were able to easily reproduce the issue!
Narrowing down the problem
We tried not using a bond (in our case, no LACP), which didn’t help. We also tried doing only transmission/reception and determined the problem only happens when receiving traffic. The diagram above can then be updated as such:

We also ruled out a single network card acting up, as the problem occurred on several servers.
Making reproducing easy
As setting this contraption of iperf servers and clients takes quite some time,
we decided to use a tool to start those in a tmux session automatically, so we
could start our reproduction method quickly. The tool in question is
tmuxp, which takes a json or YAML file
describing windows and panes and creates a tmux session from it. On node-1,
that file looked like this:
session_name: 'ceph-bench'
start_directory: /root

windows:
  - window_name: htop
    panes:
      - shell_command: htop
    start_directory: /root

  - window_name: iperf3 ens1f1
    layout: tiled
    panes:
      - shell_command: 'read && iperf3 -s -p 5201'
        focus: true
      - shell_command: 'read && iperf3 -s -p 5202'
      - shell_command: 'read && while true; do iperf3 -c 192.168.215.102 -p 5201 -t 600 -M 9000 -P 10 -l 1048576 -Z; sleep 1; done'
      - shell_command: 'read && while true; do iperf3 -c 192.168.215.103 -p 5201 -t 600 -M 9000 -P 10 -l 1048576 -Z; sleep 1; done'

  - window_name: iperf3 ens1f0
    layout: tiled
    panes:
      - shell_command: 'read && iperf3 -s -p 5203'
        focus: true
      - shell_command: 'read && iperf3 -s -p 5204'
      - shell_command: 'read && while true; do iperf3 -c 192.168.215.202 -p 5203 -t 600 -M 9000 -P 10 -l 1048576 -Z; sleep 1; done'
      - shell_command: 'read && while true; do iperf3 -c 192.168.215.203 -p 5203 -t 600 -M 9000 -P 10 -l 1048576 -Z; sleep 1; done'

  - window_name: journalctl dump
    panes:
      - shell_command: 'journalctl -fxke \> dump'
        focus: true
      - shell_command: tail -f dump

  - window_name: shell
    panes:
      - null
As you can see, we tuned some iperf3 options to make full use of the configured
MTU (-M 9000), to run for 10 minutes (-t 600), to use 10 parallel streams
(-P 10), to use zero-copy, i.e. avoid memory work to be able to send data
more quickly (-Z) and to increase the size of the buffer read for sending -l 1048576. As a result, we were easily saturating the network between our
servers.
Metrics
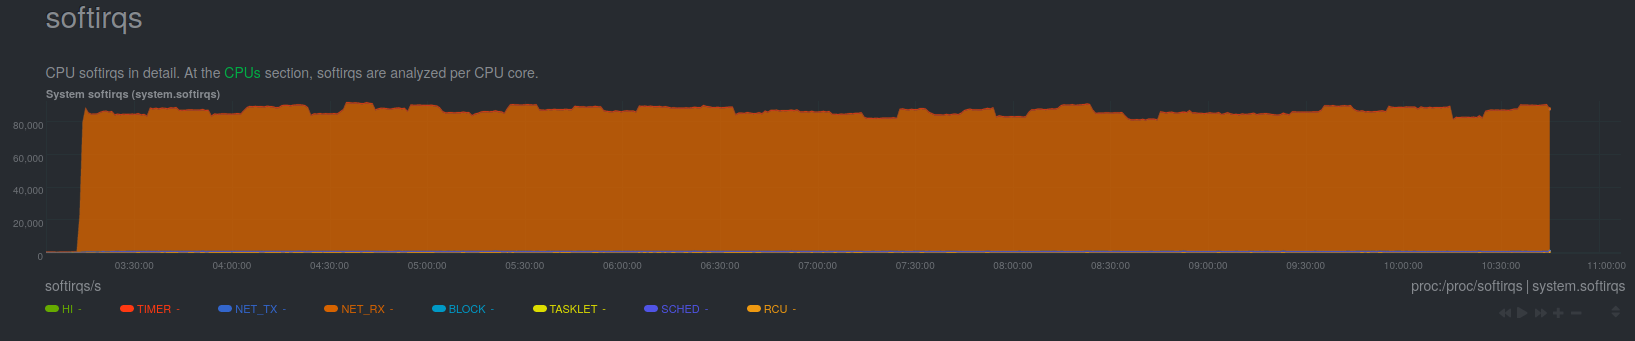
As part of our standard machine installation procedure, we install Netdata, a monitoring tool that collects metrics about a lot of things on our systems. As such, it was our go-to tool to see what was happening during the stress tests and just before the crashes. As the problem is network-related and memory-related (remember the first stack traces we looked at?), we were looking at kernel memory (specifically, the slab) usage, and network interrupts.
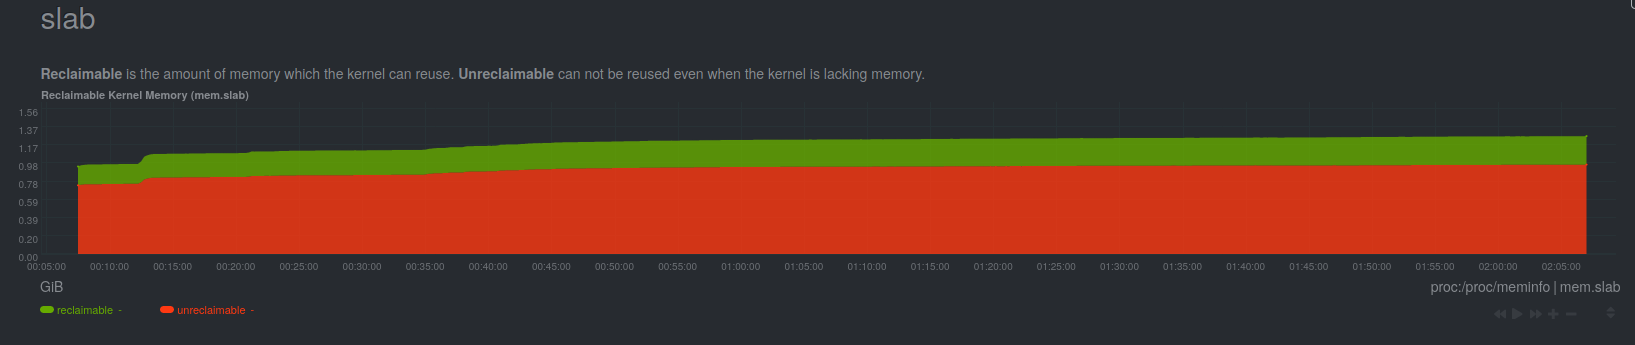
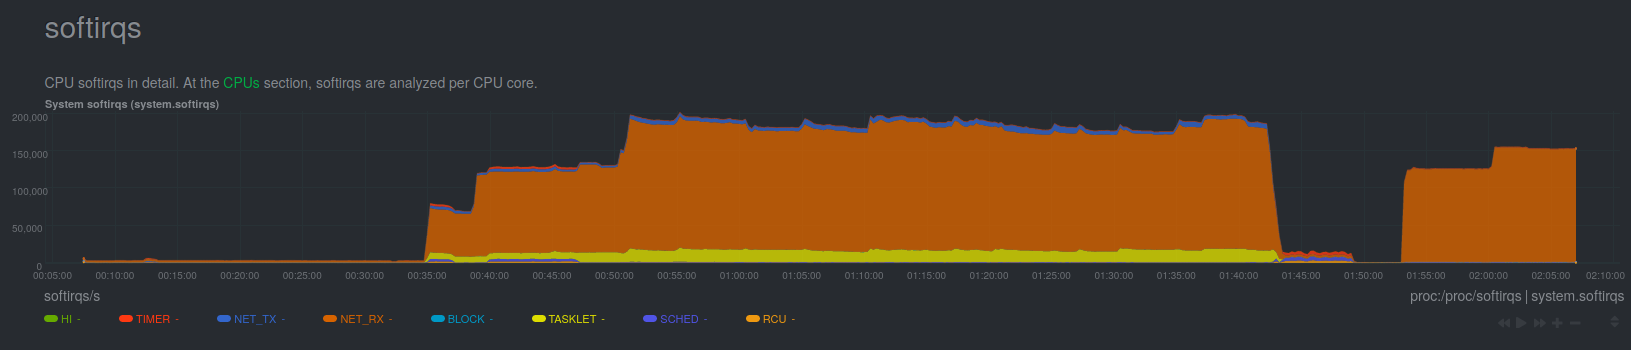
As you can see, we started the test at approximately 00:35, when the network interrupts rise, and from that point on, memory usage only keeps increasing until the server crashes, at approximately 02:07. That’s when we were starting to think the bug might be a memory leak. If that were indeed the case, we would see it occur at a slower speed, but it would take a longer period of time to trigger it. So we re-run our stress test, but this time we capped the interface speed to 1Gbps, by changing the negotiation parameters on our switch.
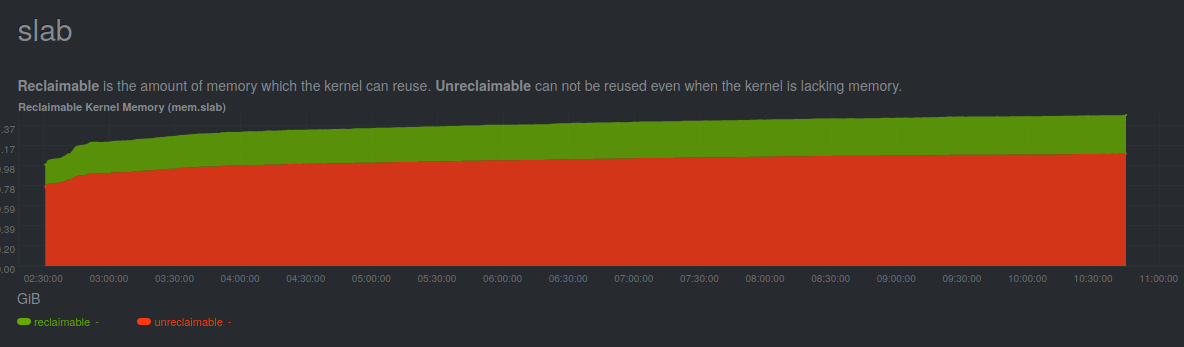
As you can see, we observe the same trend on the slab usage curve, but this time it took more than 8 hours to trigger the bug.
Getting help
We reached out on Intel’s support forum, which wasn’t much help.
Trying out versions
As we had fiddled with a custom (as in, not in-tree, but still, officially released by the manufacturer) version of the driver, we decided to try out several versions together to see which were causing the problem. Here is what we found:
| Kernel version | i40e version | Bug occurs? |
|---|---|---|
| 5.8.0 | in-tree | no |
| 5.8.0 | 2.13.10 | yes |
| 5.10.2 | in-tree | no |
| 5.10.2 | 2.13.10 | yes |
| 5.8.0 | 2.12.6 | no |
| 5.10.2 | 2.12.6 | no |
And so, the bug only occurs when using the i40e driver released by Intel at version 2.13.10.
As we had the stack trace, we thought we might be able to narrow down what changes between 2.12.6 and 2.13.10 introduced the bug.
As hopeful as we could be, we thought we might be able to git bisect a git
repository to see where the problem came from. And fools we were. Indeed, Intel
only
publishes
tarballs
of the code, even on the
SourceForge
projet where development happens.
Diffing the source code from the two releases gives 3851 changes, that is
actual code changes, not README, nor licence, nor release notes, which were of
course of no help whatsoever. But, as we knew which function was causing the
problem (from the stack trace, i40e_napi_poll), we were able to find the file
from which the problem came from and diff that instead. Which gave 714 changes.
That file, as of 2.13.10, is 4470 lines long. So we started reading it.
Going down the rabbit hole
Understanding how networking works is tricky. Understanding how the kernel handles it is even trickier. We started with the Red Hat Linux Network Performance Tuning Guide, which gives an overview of a lot of, if not all, networking-related features of the kernel. It also goes in depth about how it actually all works. It’s a very interesting read, and you should take a look if you even remotely work with networking on Linux.
ntuple filtering
Going back to reading the differences between 2.12.6 and 2.13.10, we noticed that a lot of changes were related to something called ntuple filtering. As we didn’t know what that was, we looked around a bit, and found that it’s a feature that Intel calls Ethernet Flow Director. We also ended up reading a guide by packagecloud about receiving data with the Linux networking stack. They have a similar guide about sending data. Both are great reads that we strongly recommend too. Basically, ntuple filtering allows one to direct some networking flow to a specific RX queue, associated to a specific CPU. For example, if you have a web server listening on port 80 pinned to CPU 2, you can configure your network card to queue TCP packets with destination port 80 to the RX queue on CPU 2 and thus hitting CPU caches and decrease your processing time (example gotten from the above guide). We disabled this feature on our network cards and tried again, and the bug didn’t trigger. Finally some progress! This was still leaving us quite puzzled, as we didn’t set up any ntuple filtering rules, so the code processing those shouldn’t be executed, as if ntuple filtering was disabled.
Getting help again
We reached out on the e1000-devel mailing list, which allowed us to communicate with Intel engineers directly. The full thread is available here. We then got two helpful pieces of information:
- We could ignore the message about the driver being out of date with the firmware, meaning we could run the in-tree version without any problems.
- The latest release of the driver (2.14.13) should fix our problem.
Unfortunately, production constraints did not allow us to test that latest version so we went with the in-tree version. But we’re getting ahead of ourselves.
You said memory leak?
As we wanted to discover the root of the problem, and maybe a way to fix it, we decided to find where the memory leak was coming from. To do this, we used Bcc, which is a frontend on the eBPF kernel tracer, allowing you to get results from your eBPF program in a Python environment and process them in Python, introduced to us in this article (fr). Specifically, we used the memleak.py utility, which prints outstanding allocations, i.e. allocations that haven’t been freed yet. It also groups them by stack trace, meaning you can get the code path taken to those allocations. It periodically outputs something like this:
Attaching to kernel allocators, Ctrl+C to quit.
[22:16:33] Top 10 stacks with outstanding allocations:
	71364608 bytes in 17423 allocations from stack
		__alloc_pages_nodemask+0x237 [kernel]
		__alloc_pages_nodemask+0x237 [kernel]
		alloc_pages_current+0x87 [kernel]
		pte_alloc_one+0x18 [kernel]
		__pte_alloc+0x1b [kernel]
		do_anonymous_page+0x3e4 [kernel]
		handle_pte_fault+0x22b [kernel]
		__handle_mm_fault+0x599 [kernel]
		handle_mm_fault+0xc6 [kernel]
		do_user_addr_fault+0x1e2 [kernel]
		exc_page_fault+0x86 [kernel]
		asm_exc_page_fault+0x1e [kernel]
	74801152 bytes in 18262 allocations from stack
		__alloc_pages_nodemask+0x237 [kernel]
		__alloc_pages_nodemask+0x237 [kernel]
		alloc_pages_current+0x87 [kernel]
		__page_cache_alloc+0x2b [kernel]
		page_cache_readahead_unbounded+0x93 [kernel]
		__do_page_cache_readahead+0x35 [kernel]
		do_sync_mmap_readahead+0xf5 [kernel]
		filemap_fault+0x566 [kernel]
		ext4_filemap_fault+0x32 [kernel]
		__do_fault+0x3c [kernel]
		do_cow_fault+0x7e [kernel]
		do_fault+0x3b [kernel]
		handle_pte_fault+0x1e7 [kernel]
		__handle_mm_fault+0x599 [kernel]
		handle_mm_fault+0xc6 [kernel]
		do_user_addr_fault+0x1e2 [kernel]
		exc_page_fault+0x86 [kernel]
		asm_exc_page_fault+0x1e [kernel]
		copy_user_generic_string+0x2c [kernel]
		extract_crng_user+0xa7 [kernel]
		urandom_read_nowarn.constprop.0+0x29 [kernel]
		urandom_read+0x27 [kernel]
		vfs_read+0xaa [kernel]
		ksys_read+0x67 [kernel]
		__x64_sys_read+0x1a [kernel]
		do_syscall_64+0x49 [kernel]
		entry_SYSCALL_64_after_hwframe+0x44 [kernel]
	82632368 bytes in 794542 allocations from stack
		kmem_cache_alloc+0x150 [kernel]
		kmem_cache_alloc+0x150 [kernel]
		alloc_buffer_head+0x1f [kernel]
		alloc_page_buffers+0xa3 [kernel]
		create_empty_buffers+0x1e [kernel]
		ext4_block_write_begin+0x425 [kernel]
		ext4_da_write_begin+0x115 [kernel]
		generic_perform_write+0xc2 [kernel]
		ext4_buffered_write_iter+0xa4 [kernel]
		ext4_file_write_iter+0x38 [kernel]
		new_sync_write+0x111 [kernel]
		vfs_write+0x1c5 [kernel]
		ksys_write+0x67 [kernel]
		__x64_sys_write+0x1a [kernel]
		do_syscall_64+0x49 [kernel]
		entry_SYSCALL_64_after_hwframe+0x44 [kernel]
	87068672 bytes in 21257 allocations from stack
		__alloc_pages_nodemask+0x237 [kernel]
		__alloc_pages_nodemask+0x237 [kernel]
		alloc_pages_current+0x87 [kernel]
		alloc_slab_page+0x183 [kernel]
		allocate_slab+0x7d [kernel]
		new_slab+0x4a [kernel]
		___slab_alloc+0x34b [kernel]
		__slab_alloc+0x20 [kernel]
		kmem_cache_alloc+0x209 [kernel]
		alloc_buffer_head+0x1f [kernel]
		alloc_page_buffers+0xa3 [kernel]
		create_empty_buffers+0x1e [kernel]
		ext4_block_write_begin+0x425 [kernel]
		ext4_da_write_begin+0x115 [kernel]
		generic_perform_write+0xc2 [kernel]
		ext4_buffered_write_iter+0xa4 [kernel]
		ext4_file_write_iter+0x38 [kernel]
		new_sync_write+0x111 [kernel]
		vfs_write+0x1c5 [kernel]
		ksys_write+0x67 [kernel]
		__x64_sys_write+0x1a [kernel]
		do_syscall_64+0x49 [kernel]
		entry_SYSCALL_64_after_hwframe+0x44 [kernel]
[...]
We went ahead and ran it with ntuple filtering on and off, to compare the allocations made. From now on, we will only show the allocations related to the i40e driver.
With ntuple filtering off, we got the following allocations:
[22:16:33] Top 10 stacks with outstanding allocations:
	98085120 bytes in 23955 allocations from stack
		__alloc_pages_nodemask+0x237 [kernel]
		__alloc_pages_nodemask+0x237 [kernel]
		i40e_alloc_rx_buffers+0x14a [i40e]
		i40e_napi_poll+0xda3 [i40e]
		napi_poll+0x96 [kernel]
		net_rx_action+0xb8 [kernel]
		__softirqentry_text_start+0xd0 [kernel]
		asm_call_sysvec_on_stack+0x12 [kernel]
		do_softirq_own_stack+0x3d [kernel]
		irq_exit_rcu+0x95 [kernel]
		common_interrupt+0x7c [kernel]
		asm_common_interrupt+0x1e [kernel]
		native_safe_halt+0xe [kernel]
		arch_cpu_idle+0x15 [kernel]
		default_idle_call+0x2c [kernel]
		cpuidle_idle_call+0x173 [kernel]
		do_idle+0x7a [kernel]
		cpu_startup_entry+0x20 [kernel]
		rest_init+0xae [kernel]
		arch_call_rest_init+0xe [kernel]
		start_kernel+0x43a [kernel]
		x86_64_start_reservations+0x24 [kernel]
		x86_64_start_kernel+0x8b [kernel]
		secondary_startup_64+0xb6 [kernel]
	2921987072 bytes in 713417 allocations from stack
		__alloc_pages_nodemask+0x237 [kernel]
		__alloc_pages_nodemask+0x237 [kernel]
		i40e_alloc_rx_buffers+0x14a [i40e]
		i40e_napi_poll+0xda3 [i40e]
		napi_poll+0x96 [kernel]
		net_rx_action+0xb8 [kernel]
		__softirqentry_text_start+0xd0 [kernel]
		asm_call_sysvec_on_stack+0x12 [kernel]
		do_softirq_own_stack+0x3d [kernel]
		irq_exit_rcu+0x95 [kernel]
		common_interrupt+0x7c [kernel]
		asm_common_interrupt+0x1e [kernel]
		native_safe_halt+0xe [kernel]
		arch_cpu_idle+0x15 [kernel]
		default_idle_call+0x2c [kernel]
		cpuidle_idle_call+0x173 [kernel]
		do_idle+0x7a [kernel]
		cpu_startup_entry+0x20 [kernel]
		start_secondary+0xe6 [kernel]
		secondary_startup_64+0xb6 [kernel]
	3864842240 bytes in 943565 allocations from stack
		__alloc_pages_nodemask+0x237 [kernel]
		__alloc_pages_nodemask+0x237 [kernel]
		i40e_alloc_rx_buffers+0x14a [i40e]
		i40e_napi_poll+0xda3 [i40e]
		napi_poll+0x96 [kernel]
		net_rx_action+0xb8 [kernel]
		__softirqentry_text_start+0xd0 [kernel]
		run_ksoftirqd+0x2b [kernel]
		smpboot_thread_fn+0xd0 [kernel]
		kthread+0x12f [kernel]
		ret_from_fork+0x22 [kernel]

### We stopped the test here, just before the next report

[22:24:33] Top 10 stacks with outstanding allocations:
	1564672 bytes in 191 allocations from stack
		__alloc_pages_nodemask+0x237 [kernel]
		__alloc_pages_nodemask+0x237 [kernel]
		alloc_pages_current+0x87 [kernel]
		alloc_slab_page+0x183 [kernel]
		allocate_slab+0x7d [kernel]
		new_slab+0x4a [kernel]
		___slab_alloc+0x34b [kernel]
		__slab_alloc+0x20 [kernel]
		kmem_cache_alloc+0x209 [kernel]
		__build_skb+0x24 [kernel]
		build_skb+0x17 [kernel]
		i40e_napi_poll+0x104a [i40e]
		napi_poll+0x96 [kernel]
		net_rx_action+0xb8 [kernel]
		__softirqentry_text_start+0xd0 [kernel]
		run_ksoftirqd+0x2b [kernel]
		smpboot_thread_fn+0xd0 [kernel]
		kthread+0x12f [kernel]
		ret_from_fork+0x22 [kernel]
	2101248 bytes in 513 allocations from stack
		__alloc_pages_nodemask+0x237 [kernel]
		__alloc_pages_nodemask+0x237 [kernel]
		i40e_alloc_rx_buffers+0x14a [i40e]
		i40e_napi_poll+0xda3 [i40e]
		napi_poll+0x96 [kernel]
		net_rx_action+0xb8 [kernel]
		__softirqentry_text_start+0xd0 [kernel]
		asm_call_sysvec_on_stack+0x12 [kernel]
		do_softirq_own_stack+0x3d [kernel]
		irq_exit_rcu+0x95 [kernel]
		common_interrupt+0x7c [kernel]
		asm_common_interrupt+0x1e [kernel]
		native_safe_halt+0xe [kernel]
		arch_cpu_idle+0x15 [kernel]
		default_idle_call+0x2c [kernel]
		cpuidle_idle_call+0x173 [kernel]
		do_idle+0x7a [kernel]
		cpu_startup_entry+0x20 [kernel]
		start_secondary+0xe6 [kernel]
		secondary_startup_64+0xb6 [kernel]
	22335488 bytes in 5453 allocations from stack
		__alloc_pages_nodemask+0x237 [kernel]
		__alloc_pages_nodemask+0x237 [kernel]
		i40e_alloc_rx_buffers+0x14a [i40e]
		i40e_napi_poll+0xda3 [i40e]
		napi_poll+0x96 [kernel]
		net_rx_action+0xb8 [kernel]
		__softirqentry_text_start+0xd0 [kernel]
		run_ksoftirqd+0x2b [kernel]
		smpboot_thread_fn+0xd0 [kernel]
		kthread+0x12f [kernel]
		ret_from_fork+0x22 [kernel]
Tracing with eBPF slows a lot of things down, especially when tracing every single allocation made by the kernel. And so 8 minutes elapsed between our latest trace during the stress test and the one just after. As you can see, the i40e driver allocates quite a lot of memory when working at full speed, but then starts to give it back to the kernel. It still uses some, because it is still doing networking after the test, but its memory usage decreased drastically. Now let’s see what happens with ntuple filtering on:
[21:43:55] Top 10 stacks with outstanding allocations:
	5033984 bytes in 1229 allocations from stack
		__alloc_pages_nodemask+0x237 [kernel]
		__alloc_pages_nodemask+0x237 [kernel]
		i40e_alloc_rx_buffers+0x14a [i40e]
		i40e_napi_poll+0xda3 [i40e]
		napi_poll+0x96 [kernel]
		net_rx_action+0xb8 [kernel]
		__softirqentry_text_start+0xd0 [kernel]
		asm_call_sysvec_on_stack+0x12 [kernel]
		do_softirq_own_stack+0x3d [kernel]
		irq_exit_rcu+0x95 [kernel]
		common_interrupt+0x7c [kernel]
		asm_common_interrupt+0x1e [kernel]
		copy_user_generic_string+0x2c [kernel]
		simple_copy_to_iter+0x39 [kernel]
		__skb_datagram_iter+0x19f [kernel]
		skb_copy_datagram_iter+0x40 [kernel]
		tcp_recvmsg+0x6a4 [kernel]
		inet6_recvmsg+0x5e [kernel]
		sock_recvmsg+0x54 [kernel]
		sock_read_iter+0x8f [kernel]
		new_sync_read+0x17d [kernel]
		vfs_read+0x161 [kernel]
		ksys_read+0xb1 [kernel]
		__x64_sys_read+0x1a [kernel]
		do_syscall_64+0x49 [kernel]
		entry_SYSCALL_64_after_hwframe+0x44 [kernel]
	30720256 bytes in 7501 allocations from stack
		__alloc_pages_nodemask+0x237 [kernel]
		__alloc_pages_nodemask+0x237 [kernel]
		i40e_alloc_rx_buffers+0x14a [i40e]
		i40e_napi_poll+0xda3 [i40e]
		napi_poll+0x96 [kernel]
		net_rx_action+0xb8 [kernel]
		__softirqentry_text_start+0xd0 [kernel]
		asm_call_sysvec_on_stack+0x12 [kernel]
		do_softirq_own_stack+0x3d [kernel]
		irq_exit_rcu+0x95 [kernel]
		common_interrupt+0x7c [kernel]
		asm_common_interrupt+0x1e [kernel]
		native_safe_halt+0xe [kernel]
		arch_cpu_idle+0x15 [kernel]
		default_idle_call+0x2c [kernel]
		cpuidle_idle_call+0x173 [kernel]
		do_idle+0x7a [kernel]
		cpu_startup_entry+0x20 [kernel]
		start_secondary+0xe6 [kernel]
		secondary_startup_64+0xb6 [kernel]

### We stopped the test here, just before the next report

[21:44:13] Top 10 stacks with outstanding allocations:
	5033984 bytes in 1229 allocations from stack
		__alloc_pages_nodemask+0x237 [kernel]
		__alloc_pages_nodemask+0x237 [kernel]
		i40e_alloc_rx_buffers+0x14a [i40e]
		i40e_napi_poll+0xda3 [i40e]
		napi_poll+0x96 [kernel]
		net_rx_action+0xb8 [kernel]
		__softirqentry_text_start+0xd0 [kernel]
		asm_call_sysvec_on_stack+0x12 [kernel]
		do_softirq_own_stack+0x3d [kernel]
		irq_exit_rcu+0x95 [kernel]
		common_interrupt+0x7c [kernel]
		asm_common_interrupt+0x1e [kernel]
		copy_user_generic_string+0x2c [kernel]
		simple_copy_to_iter+0x39 [kernel]
		__skb_datagram_iter+0x19f [kernel]
		skb_copy_datagram_iter+0x40 [kernel]
		tcp_recvmsg+0x6a4 [kernel]
		inet6_recvmsg+0x5e [kernel]
		sock_recvmsg+0x54 [kernel]
		sock_read_iter+0x8f [kernel]
		new_sync_read+0x17d [kernel]
		vfs_read+0x161 [kernel]
		ksys_read+0xb1 [kernel]
		__x64_sys_read+0x1a [kernel]
		do_syscall_64+0x49 [kernel]
		entry_SYSCALL_64_after_hwframe+0x44 [kernel]
	30744832 bytes in 7507 allocations from stack
		__alloc_pages_nodemask+0x237 [kernel]
		__alloc_pages_nodemask+0x237 [kernel]
		i40e_alloc_rx_buffers+0x14a [i40e]
		i40e_napi_poll+0xda3 [i40e]
		napi_poll+0x96 [kernel]
		net_rx_action+0xb8 [kernel]
		__softirqentry_text_start+0xd0 [kernel]
		asm_call_sysvec_on_stack+0x12 [kernel]
		do_softirq_own_stack+0x3d [kernel]
		irq_exit_rcu+0x95 [kernel]
		common_interrupt+0x7c [kernel]
		asm_common_interrupt+0x1e [kernel]
		native_safe_halt+0xe [kernel]
		arch_cpu_idle+0x15 [kernel]
		default_idle_call+0x2c [kernel]
		cpuidle_idle_call+0x173 [kernel]
		do_idle+0x7a [kernel]
		cpu_startup_entry+0x20 [kernel]
		start_secondary+0xe6 [kernel]
		secondary_startup_64+0xb6 [kernel]
As before, a lot of allocations were made during the stress test, but after we stopped it, they were never freed. Indeed, the number of allocations (and indeed the total size of them) only increased after stopping the stress test, which definitely confirmed our theory of a memory leak.
Going further
Now that we knew which allocations were not freed, we wanted to find out where
they should have been freed. To do so, we decided to also trace the
deallocations made by the i40e driver, when ntuple filtering is off. To do so,
we modified the
memleak.py
script to add some deallocation tracing. In fact, it was already there, since
that script tracks outstanding allocations, it must also know if those have
been freed. But that doesn’t mean that it stores where those deallocations have
been made, as such we had to get the stack traces for those. To do so, we
modified the gen_free_enter BPF function and added this chunk of code:
struct combined_alloc_info_t *info_combined = combined_allocs.lookup((u64*) &(info->stack_id));
if (info_combined == 0)
        return 0;

int stack_id = stack_traces.get_stackid(ctx, STACK_FLAGS);
if (stack_id < 0)
        return 0;
u64 *info_free = deallocs.lookup(&stack_id);

u64 nb = info_free ? *info_free : 0;

if (info_combined->number_of_allocs >= 100) {
        ++nb;
        deallocs.update(&stack_id, &nb);
}
What it does, is it gets the stack_id associated with the stack trace of the
traced kfree that we get thanks to its address (given as an argument to
gen_free_enter). We then find the number of times that deallocation has been
seen, with deallocs.lookup(&stack_id), which we updated before, or we’ll set
it to 0. deallocs is sort of a dictionary, with stack_id as key and number
of time they have been seen as value, which we declared at the start of the BPF
script with BPF_HASH(deallocs, int, u64, 1000000);. We then update that value
as we have seen one more stack trace that was the same, with deallocs.update.
We then had to add a piece of Python code to display those deallocations:
def print_outstanding_frees():
        stack_traces = bpf["stack_traces"]
        stacks = sorted(bpf["deallocs"].items(), key=lambda a: -(a[1].value))
        stacks = bpf["deallocs"].items()
        entries = []
        for stack_id, nb in stacks:
                try:
                        trace = []
                        for addr in stack_traces.walk(stack_id.value):
                                sym = bpf.sym(addr, pid,
                                                      show_module=True,
                                                      show_offset=True)
                                trace.append(str(sym, 'ascii'))
                        trace = "\n\t\t".join(trace)
                except KeyError:
                        trace = "stack information lost"

                entry = ("\t%d deallocations from stack\n\t\t%s" %
                         (int(nb.value), trace))
                entries.append(entry)

        print('\n'.join(reversed(entries)))
Rather than going through this awful processing code, here is what it shows:
146 deallocations from stack
    kmem_cache_free+0x15e [kernel]
    kmem_cache_free+0x15e [kernel]
    kfree_skb_partial+0x26 [kernel]
    tcp_add_backlog+0x47b [kernel]
    tcp_v4_rcv+0xdb6 [kernel]
    ip_protocol_deliver_rcu+0x30 [kernel]
    ip_local_deliver_finish+0x48 [kernel]
    ip_local_deliver+0xe3 [kernel]
    ip_sublist_rcv_finish+0x3d [kernel]
    ip_list_rcv_finish.constprop.0+0x163 [kernel]
    ip_sublist_rcv+0x36 [kernel]
    ip_list_rcv+0xf5 [kernel]
    __netif_receive_skb_list_core+0x228 [kernel]
    __netif_receive_skb_list+0x102 [kernel]
    netif_receive_skb_list_internal+0xc5 [kernel]
    napi_gro_complete.constprop.0.isra.0+0xfd [kernel]
    dev_gro_receive+0x200 [kernel]
    napi_gro_receive+0x3a [kernel]
    i40e_napi_poll+0x9cc [i40e]
    napi_poll+0x96 [kernel]
    net_rx_action+0xb8 [kernel]
    __softirqentry_text_start+0xd0 [kernel]
    run_ksoftirqd+0x2b [kernel]
    smpboot_thread_fn+0xd0 [kernel]
    kthread+0x12f [kernel]
    ret_from_fork+0x22 [kernel]
916 deallocations from stack
    kfree+0x17c [kernel]
    kfree+0x17c [kernel]
    skb_release_data+0x141 [kernel]
    napi_consume_skb+0x6a [kernel]
    i40e_napi_poll+0x3e3 [i40e]
    napi_poll+0x96 [kernel]
    net_rx_action+0xb8 [kernel]
    __softirqentry_text_start+0xd0 [kernel]
    asm_call_sysvec_on_stack+0x12 [kernel]
    do_softirq_own_stack+0x3d [kernel]
    irq_exit_rcu+0x95 [kernel]
    common_interrupt+0x7c [kernel]
    asm_common_interrupt+0x1e [kernel]
    __check_object_size.part.0+0x80 [kernel]
    __check_object_size+0x1c [kernel]
    simple_copy_to_iter+0x2b [kernel]
    __skb_datagram_iter+0x19f [kernel]
    skb_copy_datagram_iter+0x40 [kernel]
    tcp_recvmsg+0x6a4 [kernel]
    inet6_recvmsg+0x5e [kernel]
    sock_recvmsg+0x54 [kernel]
    sock_read_iter+0x8f [kernel]
    new_sync_read+0x17d [kernel]
    vfs_read+0x161 [kernel]
    ksys_read+0xb1 [kernel]
    __x64_sys_read+0x1a [kernel]
    do_syscall_64+0x49 [kernel]
    entry_SYSCALL_64_after_hwframe+0x44 [kernel]
Back to our i40e driver then. The first two stack traces is what happens when a
frame gets transmitted to the upper layers (IP and TCP in this case) and
transmitted to user space. The last stack trace is what happens when the
driver transmits a frame to something called napi_consume_skb, which is like
consume_skb (which
frees an
skbfuff),
but is meant to be used in a NAPI function. NAPI stands for “new API”, which is
a way for drivers to disable interrupts and instead getting polled by the
kernel for newly-received packets. And indeed, we can see at the beginning of
the stack trace that it was initiated after some syscall was invoked from user
space.
Unfortunately, as we said before, production constraints did not allow us to investigate any further.
Takeaways
Fortunately, this problem occurred while benchmarking a new system, and not in production, and as such allowed us to investigate a lot further than we normally could have done. We learned that some of the tools we use are really great for debugging, such as Netdata and tmuxp. We also learned some new tools, like BPF tracing with Bcc, which has been a very interesting experience, as it made us look into how the Linux kernel handles networking.
The End
Since then, Intel has removed the faulty driver from their website. We decided to run with the in-tree version, that has been vetted by kernel maintainers that know better, and we haven’t had any problems with it whatsoever.